Pharma R&D Manager is a round-based strategy game. Before a new quarter (next round) starts you can adjust your project portfolio, make HR decisions, buy and sell projects/compounds, adjust financials, check drug/patient safety profiles of your products etc.
The main dashboard to steer all these adaptions is the CENTRAL MANAGEMENT DASHBOARD [02]. In the OPTIONS MENU [01] you can choose which Graphical User Interface (GUI) you prefer for the CENTRAL MANAGEMENT DASHBOARD:
The Dashboard GUI: sleek and modern
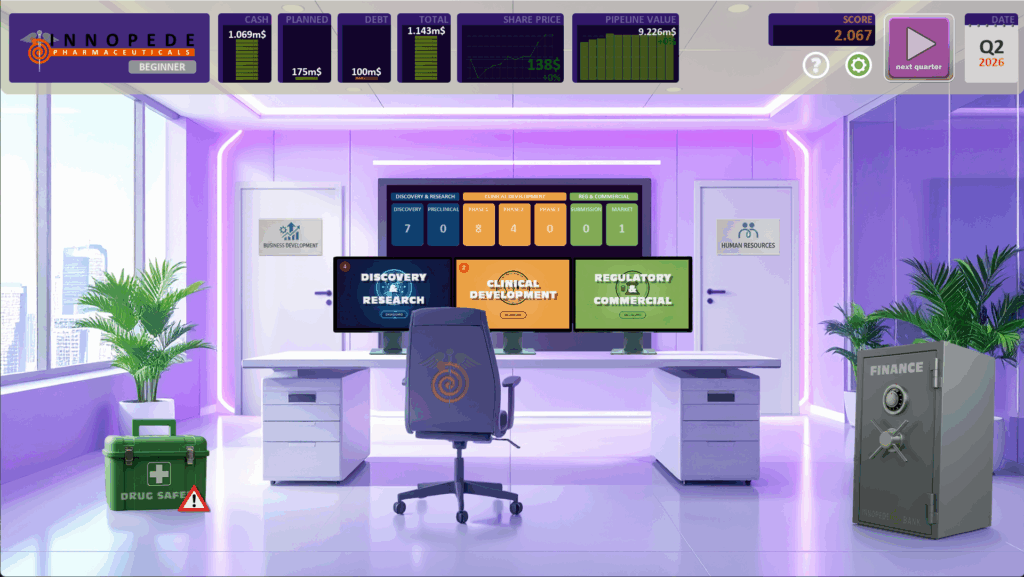
Or Office GUI: The Office GUI lets you navigate your departments in a retro-style manager’s office by interacting with items (e.g. a bank safe to access your financials).
You reach the CENTRAL MANAGEMENT DASHBOARD [02] directly after starting or loading a game.
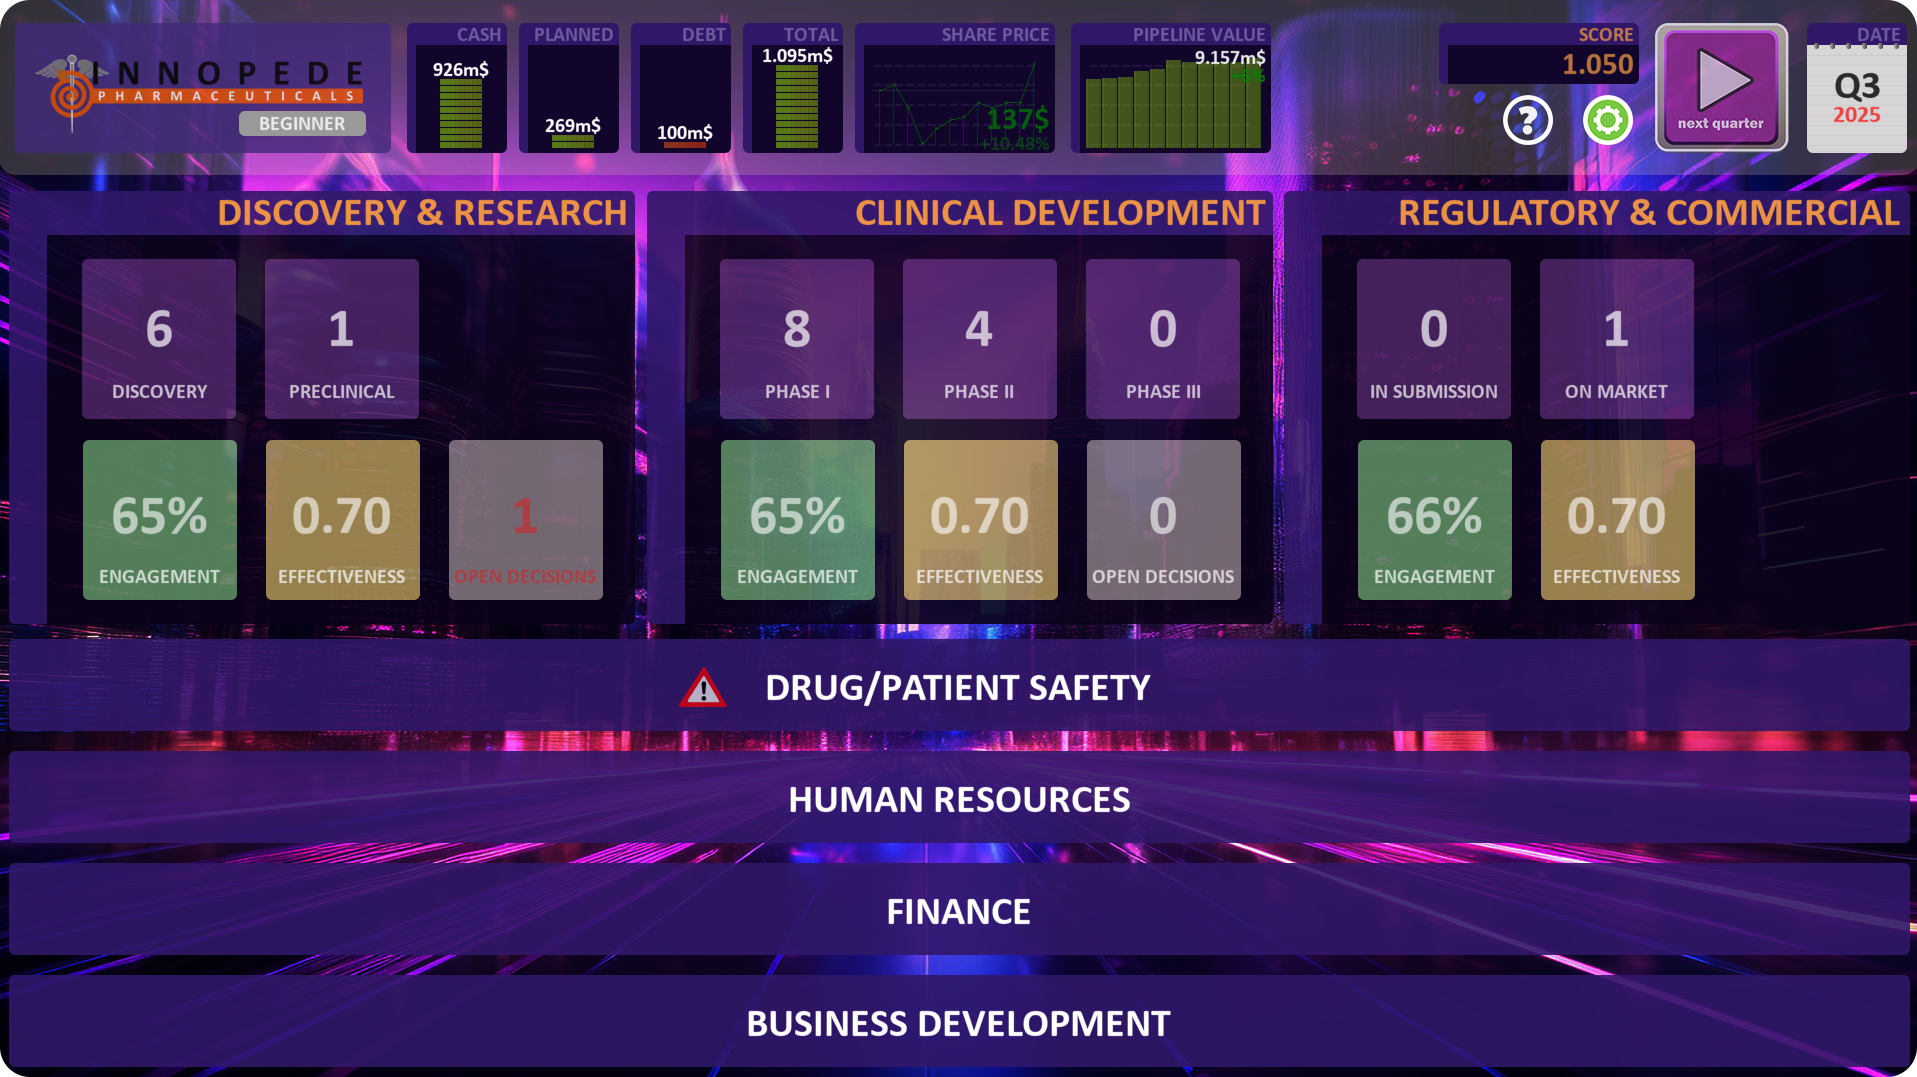
In the top menu you always see the current financial situation of your company:

- CASH – your available cash on your bank account
- PLANNED – money/budget that is already allocated to running projects
- DEBT – your current outstanding liabilities/debt
- TOTAL = cash + planned – debt
- SHARE PRICE – share price of your company
- PIPELINE VALUE – value of your pipeline taking Net Present Values and Sales into account
Additional Information on the top right of your screen:

The option symbol takes you to the OPTIONS/START MENU [01] in which you can save or load a game at a certain date or start a completely new one. You also can change sound and music settings and of course go back and continue your current game.

Clicking on the question mark (“?”) symbol will make additional question mark symbols appear on the screen and by clicking them you get more detailed explanations on certain items. This is your opportunity to learn.

The Calendar Display shows you the current quarter and year in the game.

The Score sign displays your current Game Score. The game’s score depends on your success in the game and the difficulty level you have chosen. By clicking on the Score sign you can display your latest GAME CERTIFICATE [12] and earned badges.

After you made all your decisions and adjustments in the current game round/quarter you can click on “next quarter” to move the game to the NEXT QUARTER [11]/next game round and see what happens to your portfolio, financials and teams based on your decisions and adjustments.
Dashboard GUI:
In the middle of your CENTRAL MANAGEMENT DASHBOARD you see an overview of your FUNCTIONAL DASHBOARDS [03] for your three main functions/departments:
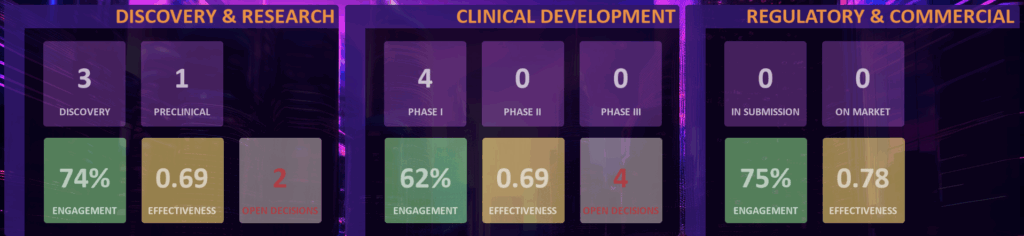
For each of these functions the number of projects in the different phases (Discovery, Preclinical, Clinical Phase I, Clinical Phase II, Clinical Phase III, Projects in submission to regulatory agencies and projects on the market). You also see the average Employee Engagement and the Effectiveness Score of these functions and if there are any open decisions you need to take. By clicking or touching on these functions you reach sub-dashboards to manage the functions in detail.
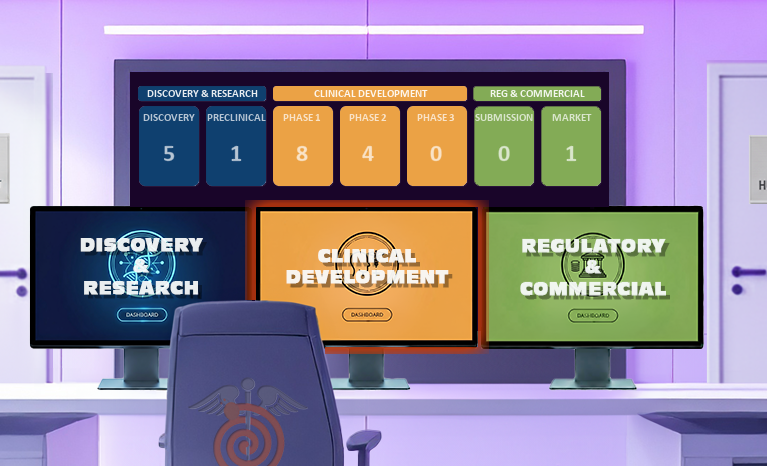
Office GUI:
here you can select the different functional dashboards by clicking on the screens for DISCOVERY & RESEARCH, CLINICAL DEVELOPMENT or REGULATORY & COMMERCIAL.
Dashboard GUI:
In addition to the three main functions, you also have on the bottom of the screen links/buttons to the most important supporting functions:

By clicking/tap on one of these functions you reach specific sub-dashboards with more detailed adjustment possibilities.
Office GUI:
Just click on the different elements to enter the supporting functions dashboards.

- DRUG/PATIENT SAFETY [07]: first aid kit
- HUMAN RESOURCES [08]: door on the right
- FINANCE [09]: bank safe on the floor
- BUSINESS DEVELOPMENT [10]: door on the left
![BUSINESS DEVELOPMENT [10]](https://pharma-game.com/wp-content/uploads/2025/07/business_development.png)
By clicking/tap on one of these functions you reach specific sub-dashboards with more detailed adjustment possibilities.

IMPORTANT: In all sub-dashboards you can go back by clicking/touching the BACK Button or by just click on the right mouse button (only Windows or Mac)